Selenium Grid: Why Two Nodes Disagree
A session lands on whichever node had a free slot. Record what the profile fixes and what the host still decides, so a difference is attributed to a node, not a commit.
BotBrowser Team
Want the structured docs for Documentation?
This article lives in the editorial library. For step-by-step setup, reference material, and ongoing updates, jump into the docs section.
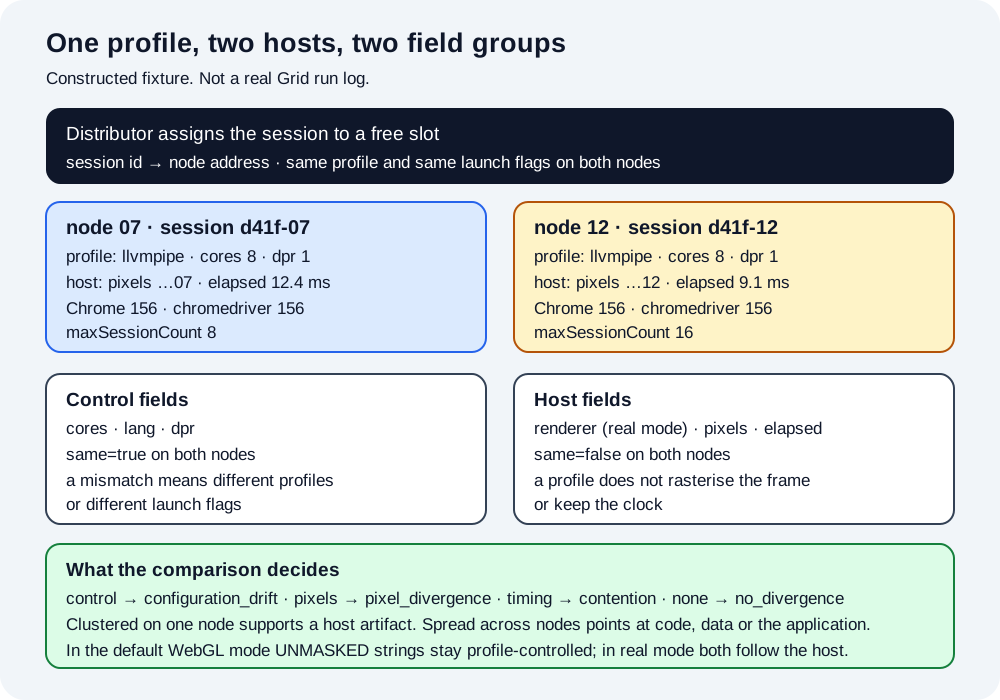
A Selenium Grid test does not run on the machine that submitted it. The Distributor assigns the session to a slot on some node, and the browser that executes the test is the one installed on that node. Two nodes running the same test, the same code and the same browser version can still produce different results, because a slot is a scheduling unit rather than a guarantee that the environment is identical. The first question after such a failure is not which assertion broke but which node ran it, and the answer has to come from a record rather than from a rerun. BotBrowser pins the identity values a page reads through one profile, and it does not directly control the rasteriser or the clock the host provides, so the pixels a host draws and the time it takes are exactly the fields that still differ between nodes.
TL;DR
- A Grid slot is a scheduling unit. The Distributor assigns a session to whichever slot matches the request, so the node that runs a test is chosen at run time, not by the test file.
- Split the record into control fields and host fields. In the default WebGL mode a control field such as the UNMASKED renderer string or
navigator.hardwareConcurrencyshould be identical when the same profile is applied; if it differs, the profiles or the launch flags differ. - A host field such as a pixel hash or an elapsed time can still differ with a perfect profile, because the profile does not rasterise the frame or keep the clock.
- Store the session id with every attempt. The capability map does not carry a node id, so node identity comes from the Grid's own GraphQL or UI lookup for that session.
- A failure that clusters on one node supports a host artifact; a failure that spreads evenly across nodes points at code, data or the application.
Contents
- What a node and a slot are
- Two kinds of field in one record
- Capture one record per attempt
- Attribute a failure to a node
- Separate contention from divergence
- What a profile pins and what it cannot
- Practical conclusion
What a node and a slot are
The Grid splits into a Router, a New Session Queue, a Distributor, a Session Map and one or more Nodes. The Router forwards an incoming request either to the queue or to the node that already owns the session, and the Distributor assigns a new session to a free slot. Each node has one or more slots, and each slot carries a stereotype: the minimum set of capabilities a request must match before the Distributor will send it to that node. The Session Map keeps the mapping between a session id and the address of the node running it.
That structure explains the first thing a flaky Grid test teaches. A request with the same capabilities can be answered by any node whose slot stereotype matches, so consecutive runs of one test can execute on different hosts without any change to the test. When a node registers, it auto-registers the browser drivers available on its own PATH and creates one slot per available CPU for Chromium-based browsers and Firefox, while Safari gets a single slot. Two nodes with different core counts therefore advertise different numbers of slots from the same test's point of view.
Node registration also carries a nodeId UUID and an osInfo object with arch, name and version, which the Grid UI and GraphQL queries expose. Those two fields are what turn "the test failed" into "the test failed on this node". Reading them costs one lookup and settles an argument that otherwise runs for days.
The queue matters for the same reason. When every matching slot is busy, the new session waits rather than failing, so a test that runs during a peak period starts later than the same test run alone. A timeout measured from the moment the test process started therefore includes queue time, and a suite that sets its own deadlines without knowing that will report a scheduling delay as an application timeout. The Distributor also keeps a model of the Grid, and the architecture documentation notes that this model can fall out of sync with reality, for example right after the Distributor starts; a session routed to a slot that no longer answers looks like a network failure from inside the test.
None of these components compares two nodes. The Grid assigns work and tracks sessions; it does not tell you whether node seven and node twelve produce the same pixels. That comparison has to be built into the test's own record.
Two kinds of field in one record
Most node comparisons fail before they start because they mix two questions into one table. One question is whether the declared environment arrived; the other is whether the host behaves the same way. A profile answers the first and cannot answer the second, so the record has to separate them.
| Field | Who decides the value | What a difference means |
|---|---|---|
| UNMASKED vendor and renderer strings | The profile, or the host in --bot-webgl=real mode | Different profiles, or two hosts with different WebGL stacks |
navigator.hardwareConcurrency | The profile by default, or the host with --bot-cores=real | The profiles differ, or one node was launched with a real-core override |
| Screen dimensions, locale, timezone | The profile, unless overridden per session | A configuration difference, not a rendering difference |
| Browser and driver version | What the node registered | A capability match that ignores version routed the request to two builds |
Pixel hash of a fixed draw, --bot-webgl=real | The host's rasteriser | A genuine host difference that survives a correct profile and a real WebGL mode |
| Elapsed time for a fixed step | The host's CPU, load and network | Contention or a hardware difference, not an identity difference |
The first three rows are control fields when the launch uses the default WebGL mode, and they should be identical on both nodes when the same profile and the same launch flags are used, so a difference there is a configuration bug with a cheap fix. The renderer row carries a caveat that matters for this measurement: in --bot-webgl=real mode WebGL is served from the host with no protection, so the UNMASKED strings follow the host stack and the row stops being a control field. That is why the pixel digest needs real mode and the renderer string does not belong in the same comparison as a control. BotBrowser's profile-configuration documentation lists the identity values a profile supplies, including screen and window dimensions, fonts, WebGL and WebGPU, media devices and speech voices, and its profile-management documentation lists hardware signals such as device memory, CPU core count and GPU model among the values a profile carries. The --bot-cores flag is documented to choose between the profile's claimed count and the host's real count, and the default keeps the profile's claim.
The last two rows are host fields, and this is where the surprise lives. A profile controls what the page is told about the GPU, not what the GPU driver actually computes. BotBrowser's Linux GPU backend documentation states this directly: different software rasterisers produce different pixel output for the same shader, so the exact bytes coming out of readPixels or toDataURL differ between SwiftShader and Mesa llvmpipe, while in the default WebGL mode the UNMASKED vendor and renderer strings stay controlled by the profile and are unchanged by that migration. Under --bot-webgl=real that guarantee is deliberately switched off, so the same migration moves both the pixel bytes and the reported strings. A canvas comparison across two nodes is therefore a host comparison even when the identity values match perfectly.
Keeping both groups in one record is what makes the diagnosis possible. A mismatch in the control group says the two runs were not the same experiment; a mismatch in the host group says they were the same experiment on two different machines. Confusing the two leads teams to re-roll a profile when the real problem is a rasteriser, or to rewrite a test when the real problem is a missing profile field.
The capabilities a test sends describe an intent; the values a page reads describe an outcome. The two are not the same, and the gap between them is where most node divergences hide. A request can ask for Chrome without a version, ask for a platform name without a version, and ask for a window size that the node quietly adjusts to fit its display. What the page then reports is what the application actually receives, so that is what belongs in the record.
The example below collects a short, fixed list from inside the running session: three control fields, one pixel digest and one timing. It prints one line, which is enough to compare two nodes and small enough to attach to a report without leaking account data.
from selenium import webdriver
from selenium.webdriver.chrome.options import Options

options = Options()
options.add_argument("--bot-gpu-emulation=false")
options.add_argument("--bot-webgl=real")

driver = webdriver.Remote(command_executor="http://grid.internal:4444", options=options)
try:
    driver.get("https://app.example.test/health")
    values = driver.execute_script(
        """
        const canvas = document.createElement('canvas');
        canvas.width = 220; canvas.height = 90;
        const gl = canvas.getContext('webgl');
        const dbg = gl && gl.getExtension('WEBGL_debug_renderer_info');
        const vs = [
          'attribute vec2 p;',
          'varying vec2 uv;',
          'void main() { uv = p * 0.5 + 0.5; gl_Position = vec4(p, 0.0, 1.0); }',
        ].join('\n');
        const fs = [
          'precision mediump float;',
          'varying vec2 uv;',
          'void main() {',
          '  float a = (sin(uv.x * 37.0 + 1.7) + sin(uv.y * 23.0 + 3.1) + sin((uv.x + uv.y) * 61.0)) / 3.0;',
          '  float b = fract(uv.x * 41.0) * fract(uv.y * 29.0);',
          '  gl_FragColor = vec4(0.5 + 0.45 * a, b, 0.5 - 0.45 * a, 1.0);',
          '}',
        ].join('\n');
        // Measured with --bot-gpu-emulation=false --bot-webgl=real. The defaults would answer
        // this draw from the profile GPU layer, and the digest would describe the profile.
        let digest = null;
        if (gl) {
          const compile = (type, src) => {
            const s = gl.createShader(type);
            gl.shaderSource(s, src);
            gl.compileShader(s);
            return gl.getShaderParameter(s, gl.COMPILE_STATUS) ? s : null;
          };
          const program = gl.createProgram();
          const vertex = compile(gl.VERTEX_SHADER, vs);
          const fragment = compile(gl.FRAGMENT_SHADER, fs);
          if (!vertex || !fragment) return { pixels: null, pixels_error: 'compile_failed' };
          gl.attachShader(program, vertex);
          gl.attachShader(program, fragment);
          gl.linkProgram(program);
          if (!gl.getProgramParameter(program, gl.LINK_STATUS)) return { pixels: null, pixels_error: 'link_failed' };
          gl.useProgram(program);
          const buffer = gl.createBuffer();
          gl.bindBuffer(gl.ARRAY_BUFFER, buffer);
          gl.bufferData(gl.ARRAY_BUFFER, new Float32Array([-1, -1, 3, -1, -1, 3]), gl.STATIC_DRAW);
          const p = gl.getAttribLocation(program, 'p');
          gl.enableVertexAttribArray(p);
          gl.vertexAttribPointer(p, 2, gl.FLOAT, false, 0, 0);
          gl.clearColor(0.0, 0.0, 0.0, 1.0);
          gl.clear(gl.COLOR_BUFFER_BIT);
          gl.drawArrays(gl.TRIANGLES, 0, 3);
          const bytes = new Uint8Array(220 * 90 * 4);
          gl.readPixels(0, 0, 220, 90, gl.RGBA, gl.UNSIGNED_BYTE, bytes);
          let h = 2166136261;
          for (let i = 0; i < bytes.length; i += 4) h = Math.imul(h ^ bytes[i + 1], 16777619) >>> 0;
          digest = h.toString(16).padStart(8, '0');
        }
        const started = performance.now();
        for (let i = 0; i < 20000; i += 1) Math.sqrt(i);
        return {
          renderer: dbg ? gl.getParameter(dbg.UNMASKED_RENDERER_WEBGL) : null,
          cores: navigator.hardwareConcurrency,
          lang: navigator.language,
          dpr: window.devicePixelRatio,
          pixels: digest,
          elapsed: Math.round((performance.now() - started) * 100) / 100,
        };
        """
    )
    print({"session": driver.session_id, "browser": driver.capabilities.get("browserVersion"), **values})
finally:
    driver.quit()
The list is deliberately short and deliberately mixed. cores, lang and dpr are control fields: a profile supplies them, so they should match on both nodes and a mismatch is the first thing to investigate. renderer is a control field only in the default WebGL mode and moves to the host side under --bot-webgl=real, which is why the worked record below keeps it out of the control group. pixels is a host field: it draws one fixed full-screen triangle whose fragment shader mixes three sine terms with a fract product, reads every pixel back with readPixels, and folds the green channel into a short FNV-1a digest. Interpolation and sub-pixel coverage are precisely where two rasterisers diverge, so the shader has to vary across the surface: a constant colour, and a clear in particular, returns the same bytes on every backend and measures nothing. Two launch conditions make the measurement mean what it claims. GPU emulation has to be off, and WebGL has to be in real mode: the defaults answer a WebGL draw from the profile layer, which controls shader output and image readback as well as the identity strings, so a run left on the defaults measures the profile and then reports it as a host field. The record also carries devicePixelRatio, because the digest depends on how many pixels the surface has; a node that renders the same scene at a different scale produces a different digest for a reason that has nothing to do with its rasteriser. elapsed is a host field too, and a coarse one, so it separates contention from identity without pretending to be a benchmark.
Two implementation details change what the record means. The capability map does not contain a node id, so the script prints the session id and the node identity is resolved from the Grid afterwards; assuming a nodeId capability exists produces None on every node and silently removes the only field that makes attribution possible. And the renderer string is only available when the debug-renderer extension exists; a browser that withholds it returns null, which is itself a signal that the value was masked rather than reported.
Capture one record per attempt
The record that makes divergence visible is small: the node identity, the build identity, and the two field groups. The builder below is a constructed fixture showing what one test looks like on two nodes that share one profile.
// Constructed fixture: one test, two attempts, one shared profile, two hosts.
const attempts = [
  {
    n: 1,
    session: 'd41f-07',
    browser: 'Chrome 156.0.0.0',
    control: { cores: 8, lang: 'en-US', dpr: 1 },
    host: { pixels: 'fc0472cd', elapsed: 12.4 },
  },
  {
    n: 2,
    session: 'd41f-12',
    browser: 'Chrome 156.0.0.0',
    control: { cores: 8, lang: 'en-US', dpr: 1 },
    host: { pixels: '3b9e51a0', elapsed: 9.1 },
  },
];

const controlKeys = Object.keys(attempts[0].control);
const controlDrift = controlKeys.filter(k => attempts[0].control[k] !== attempts[1].control[k]);
const pixelsMissing = attempts.some(a => a.host.pixels == null);
const pixelDrift = !pixelsMissing && attempts[0].host.pixels !== attempts[1].host.pixels;
const elapsedDrift = attempts[0].host.elapsed !== attempts[1].host.elapsed;
const verdict = controlDrift.length
  ? 'configuration_drift'
  : pixelsMissing
    ? 'pixel_unavailable'
    : pixelDrift
      ? 'pixel_divergence'
      : elapsedDrift
        ? 'contention'
        : 'no_divergence';

const lines = [
  `attempts=${attempts.length} browser_same=${attempts[0].browser === attempts[1].browser}`,
  ...controlKeys.map(k => `control=${k} same=${attempts[0].control[k] === attempts[1].control[k]}`),
  `host=pixels same=${pixelDrift ? 'false' : 'true'}`,
  `host=elapsed same=${elapsedDrift ? 'false' : 'true'}`,
  `verdict=${verdict}`,
];

// The non-default branches are what separate the causes; print one line each so a
// reader can check the rule rather than trust it.
const cases = [
  { pixels: 'p', elapsed: 1 },
  { pixels: 'q', elapsed: 1 },
  { pixels: 'p', elapsed: 9 },
  { pixels: 'p', elapsed: 1 },
  { pixels: null, elapsed: 1 },
];
for (let i = 0; i + 1 < cases.length; i += 1) {
  const a = cases[i];
  const b = cases[i + 1];
  const missing = a.pixels == null || b.pixels == null;
  const branch = missing
    ? 'pixel_unavailable'
    : a.pixels !== b.pixels
      ? 'pixel_divergence'
      : a.elapsed !== b.elapsed
        ? 'contention'
        : 'no_divergence';
  const samePixels = a.pixels == null || b.pixels == null ? 'null' : a.pixels === b.pixels;
  lines.push(`branch=${branch} pixels_same=${samePixels} elapsed_same=${a.elapsed === b.elapsed}`);
}
console.log(lines.join('\n'));
The constructed output is the point, in two parts. Every control field matches, because both nodes loaded the same profile, while the pixel digest differs, so the verdict is pixel_divergence rather than a configuration bug. The printed branches then show the rule that keeps the verdict honest: a record whose pixels match and whose elapsed time differs is reported as contention, not as a node rendering difference.
attempts=2 browser_same=true
control=cores same=true
control=lang same=true
control=dpr same=true
host=pixels same=false
host=elapsed same=false
verdict=pixel_divergence
branch=pixel_divergence pixels_same=false elapsed_same=true
branch=pixel_divergence pixels_same=false elapsed_same=false
branch=contention pixels_same=true elapsed_same=false
branch=pixel_unavailable pixels_same=null elapsed_same=true
Three rules keep the record useful. Read the values inside the session rather than from the test's requested capabilities, because the request describes intent and the page describes what arrived. Classify each field as control or host before comparing anything, because the two mismatches have different owners. And keep the field list short and fixed, so two records can be compared mechanically instead of by eye.
Attribute a failure to a node
Attribution is a distribution question. Collect the nodeId of every attempt of the failing test and count how the failures spread. A failure that appears on one node and never on the others supports a host artifact, and the next step is to compare that node's host fields against a passing node's. A failure that appears on every node at roughly the same rate is not a node problem, and time spent diffing hosts is time not spent on the code, the fixture or the application.
A second distribution matters as much. When a node advertises more slots than the host can serve comfortably, several sessions share one machine and each session sees more contention. A test that fails only when the node is at capacity is a scheduling artifact rather than a rendering difference, and the record separates them because contention moves the elapsed field while a rasteriser difference moves the pixel field.
The Selenium profile integration guide covers who owns the launch, the user-data directory and the session close on a node; the waits analysis covers the timing half of the same diagnosis. The step before both is deciding whether the difference came from the host at all.
Separate contention from divergence
A node that runs four sessions at once does not behave like a node that runs one. The Distributor considers a node full when it reaches maxSessionCount, and by default a node advertises one slot per available CPU for Chromium-based browsers and Firefox, so a sixteen-core host can accept sixteen concurrent sessions unless the configuration says otherwise. Each of those sessions competes for the same memory bandwidth, the same rasteriser and the same disk, and a test that measures anything about time will see the contention before it sees any identity difference.
The distinction matters because the two failure shapes look alike in a report and have different fixes. A contention failure appears only when the node is busy, moves between tests rather than between nodes, and disappears in a serial run. A divergence failure appears whenever a particular node runs the test, whether the node is busy or idle, and reproduces in a serial run on that node. Recording the concurrent session count next to the node identity is what separates them, because the count is the variable that changed.
Contention is also the reason a node count is a poor proxy for capacity. Adding nodes to a Grid increases the number of hosts available, but it does not change how many sessions each host accepts, and a fleet that is short on memory per session will keep producing the same contention failures at a larger scale. The maxSessionCount setting and the memory available per session are the two numbers that decide this, and both belong in the node's record rather than in a team's memory.
There is a third shape that is neither contention nor divergence: a test that depends on data that changes over time. A price, a date or a list length that the fixture assumed to be fixed will fail on a schedule that has nothing to do with which node ran it, and the record shows it because the failing attempts spread evenly across nodes and across load levels. The four-cause attribution model treats that case as its own cause for exactly this reason.
What a profile pins and what it cannot
The identity half of the record is what a profile is for. BotBrowser documents the identity values a profile supplies and applies them before any page script runs, which does not give it control of the rasteriser or the clock, so in the default WebGL mode the UNMASKED vendor and renderer strings, the reported core count, the screen dimensions, the font list and the language stack are the same on every host that loads the same profile with the same launch flags. Under --bot-webgl=real the strings follow the host instead, the one row that leaves the control group in that mode. That is what makes a control-field comparison meaningful, and it is why a control mismatch points at configuration rather than at hardware.
The other half is out of reach by design. A profile does not rasterise the frame, so the bytes a software backend writes for one shader differ between backends even with an identical profile. It does not schedule the work either, so a fixed step takes longer on a busier or slower host. BotBrowser's cross-platform guidance states that portability requires the same BotBrowser version, the same profile file and the same launch flags, and its headless server guidance documents that a server without a GPU renders through one of several software backends whose trade-offs differ. A suite that compares pixel output across nodes therefore still has to record the backend and the node, and a suite that measures latency still has to record the load.
FAQ
Why does the same test pass on one node and fail on another?
The Distributor assigned the two runs to different slots. Compare the two node records before touching the test: the control fields first, because a mismatch there means the profiles or launch flags differed, and then the host fields, because a mismatch there means two machines rendered or timed the same work differently.
Can a profile make two Grid nodes identical?
No. A profile pins the identity values a page reads, which removes a large class of divergence, but the host still supplies the rasteriser, the CPU scheduling and the clock. Identical pixels require the same rendering backend as well as the same profile, and identical timings require the same load.
Why can the renderer string match while the pixels differ?
Because the two are decided by different layers, and by different launch modes. In the default WebGL mode the renderer string is an identity value the profile supplies, while the pixels are what the host's rasteriser computes, so a matching string and a differing pixel digest is the expected pair. BotBrowser's GPU backend documentation states that in that mode the UNMASKED strings stay profile-controlled through a backend migration while the pixel bytes change. Under --bot-webgl=real the strings follow the host instead, so on two nodes with different WebGL stacks both the string and the digest move together.
How many attempts are needed before calling a failure node-specific?
Enough that the failure is absent from the other nodes under the same load. A single failure on one node and a single pass on another is a hypothesis; a pattern across repeated attempts is an attribution.
Sources
- Selenium Grid architecture
- Selenium Grid components
- Selenium WebDriver drivers
- BotBrowser profile configuration
- BotBrowser profile management
- BotBrowser cross-platform profiles
- BotBrowser headless server setup
- BotBrowser Linux GPU backend selection
- BotBrowser CPU core scaling
Practical conclusion
A node that disagrees with another can also be running a different browser build, which is a separate cause with a separate fix; Chrome for Testing: pinning a build, not a fingerprint covers how to pin and what a pin leaves outside it.
Record the session id, the browser and driver version, three control fields, one pixel digest and one timing on every attempt of every Grid test. Compare control fields first: a mismatch there is a configuration bug, not a hardware mystery. Compare host fields second: a mismatch there is the difference a profile cannot remove, so record the backend, the load and the node instead of re-rolling the profile. Treat a failure that clusters on one node as support for a host artifact and a failure that spreads as a code or data problem.
Related Articles
Flaky Tests: Four Causes and Their Artifacts
ComparisonAd Verification: Region and Language Must Agree
Getting StartedSelenium Scraping: Capabilities and Records
ComparisonWhat Does an Anti-Detect Browser Change?
Getting StartedHeadless Browser Selenium: Chrome Options and What Differs
FingerprintUnicode Normalization: Four Text Identities a Page Reads
Run the same check in BotBrowser
Load a profile, keep the signals you just read about consistent inside the browser, and confirm the result on your own machine before a rollout.