Chromium 151 BrowserContext Memory: Release Case Study
Review measured Chromium 151 BrowserContext memory changes, a temporary startup setting, and the limits of the available evidence.
BotBrowser Team
Want the structured docs for Deployment?
This article lives in the editorial library. For step-by-step setup, reference material, and ongoing updates, jump into the docs section.
Chromium 151 capacity planning changes when live BrowserContexts carry release-specific memory cost. BotBrowser can run isolated BrowserContexts with per-context profiles, but it cannot remove the browser-UI renderer cost, guarantee a memory limit, or size host headroom; measure the target release, host, and workload.
TL;DR
One Linux x64 comparison found about 120 MB per active context on 151.0.7922.76 and about 289 MB on 151.0.7922.138, alongside an extra browser-UI renderer. These are release-case observations, not capacity guidance or universal constants.
Contents
- What the comparison tells us
- Upgrade checks that produce a useful baseline
- Capacity-planning boundary
- The temporary startup mitigation
- Release conclusion
- Evidence boundary and reproducible experiment
Release-specific observation
Many automation services share one browser group across a large number of live BrowserContexts. Each context keeps its own storage and application session, while the group avoids repeating browser startup work. That arrangement can be efficient, but the cost of a context is a property of the browser release as well as the page workload.
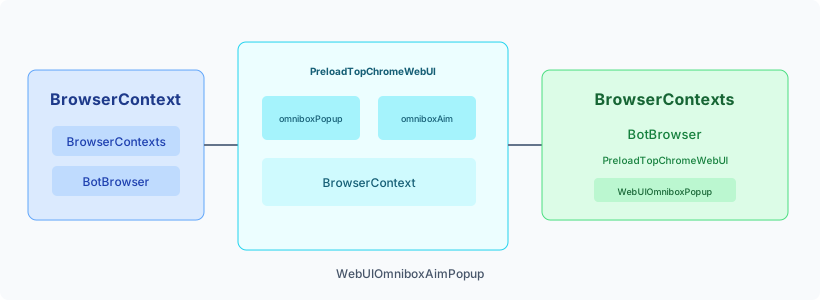
Some Chromium 151 builds from 151.0.7922.108 onward have a higher baseline in headless or automation workloads with many live contexts. An active context can be accompanied by an additional browser-UI renderer associated with the browser's own interface. Memory therefore grows with active context count even when the page itself has not changed.
This is a release-specific observation, not a capacity planning guide or a claim about every Chromium build or operating system. The same release family can behave differently across maintenance builds, and Linux x64 is only one comparison environment.
The practical consequence is a release comparison that needs fresh evidence before an operator changes a context budget. The recorded observation is complemented by linked capacity and scaling guides, which own admission, queue, and host policy.
What the comparison tells us
On one Linux x64 comparison host, Chromium 151.0.7922.76 did not show the additional omnibox UI renderer in this workload. The observed cost was about 120 MB per live context. A later comparison at 151.0.7922.138 did show the additional renderer, with an observed cost of about 289 MB per live context. The difference is roughly 169 MB per context in that particular setup.
The additional renderer itself was commonly around 250 to 280 MB in the observed examples. These are not pricing units, guarantees, or portable constants. A context running a media-heavy page, a document renderer, a large application, or several workers can use much more. A quiet page can use less. Shared browser memory also needs to be accounted for separately from the per-context slope.
The useful model is a measured baseline plus a measured slope:
group memory = shared browser memory + (active contexts × context cost) + workload variation
Do not turn that expression into a universal calculator. It is a way to compare the same build, host, profile, and workload under controlled conditions.
The comparison explains why a maintenance-build change can look like a capacity regression without a page change. It does not establish a scheduler limit or a permanent allocation.
Keep the observation window beside the exact build and workload. A repeat run should state what changed instead of turning one successful sample into an operating promise.
The useful unit of evidence is the comparison pair, not the headline number. Keep the older and newer build identifiers beside every sample, and record whether the browser group was newly started or already warm. Use the same profile package, extensions, graphics mode, container limit, and representative transaction for both builds. A page that opens a document, starts workers, or creates a download can have a different process shape from a quiet navigation, so the workload description belongs beside the RSS measurement. Process count is an observation rather than a diagnosis: an extra renderer may be specific to the build and interface path, while the same total RSS can come from page activity on another run.
Compare the groups in a controlled order. Measure the no-flag baseline, then the complete two-name omnibox setting, then the partial PreloadTopChromeWebUI setting. Allow the browser group to return to its normal idle range between runs and repeat a point when a supervisor restart or unrelated service changes the host. Capture memory before context creation, at several live-context counts, during steady activity, and after close. The close observation matters because a process released after context teardown has a different meaning from one that remains resident, but release timing still depends on the workload and build. Keep the result as a dated experiment record; do not convert it into a promise about another operating system, page class, or future maintenance build.
This comparison prevents a misleading mitigation claim. If the complete setting lowers the observed total, that is evidence about this launch configuration on this build, not proof that the page or profile was otherwise unchanged. If only the partial setting changes the total, record that difference instead of presenting it as removal of the renderer. If neither setting changes behavior, preserve the control result and investigate the workload with the general capacity and lifecycle guides. The release case is valuable because it separates a version-specific observation from the operational policy that consumes it.
Upgrade checks that produce a useful baseline
Compare the approved build with the candidate on the same host image, profile, and transaction. Record group memory and live-context count before creation, during steady activity, and after close; note whether the extra renderer remains. A change in the per-context slope is release evidence, not an operating limit.
For each build, compare observations at the same live-context counts rather than comparing only the final group totals. The shared browser baseline is present even when the context count is zero; subtracting that baseline helps distinguish shared startup cost from the incremental cost associated with active contexts. In this case, the observed difference between the two per-context figures is about 169 MB. It is not the same quantity as the 250 to 280 MB attributed to the additional renderer in the recorded examples: the group total also includes other shared and workload-dependent memory. Keep those measurements separate in the release note.
If the candidate's slope changes while the shared baseline remains similar, the release comparison points toward a context-associated change. If both the baseline and slope move, report both rather than attributing the entire total to the extra renderer. A group that has not returned to its normal idle range can distort a later sample, so mark that run and repeat it instead of averaging it into the comparison. The same caution applies when context creation order or close timing differs. These observations narrow the release question; they do not identify which internal allocation changed or prescribe a safe concurrency count. Tag each observation with its exact build and context count.
Pair the build with its profile package using the browser release validation routine. For identity-separated workloads, confirm that the measurement preserves the approved session boundary described in the per-context fingerprint documentation.
Capacity-planning boundary
The BrowserContext capacity planning guide and scaling guide cover workload budgets, admission, queues, cleanup, and lifecycle ownership. Those general operating procedures are outside this release case study.
For this release comparison, keep the browser binary, profile package, feature flags, and measurement method together in one record. A result from a different maintenance build should be treated as a new observation, even when the major version remains Chromium 151. The same applies when the host image changes, when a container limit is tightened, or when the representative transaction starts using media, documents, downloads, or additional workers. Those changes can alter both the shared baseline and the incremental slope, so they cannot be folded into the earlier number without a repeat run.
The purpose of the comparison is to identify a release change that deserves operational attention. It is not to select the largest number of contexts that survived one sample. A measured increase can justify a smaller temporary assignment, a separate validation group, or a return to the previous build while evidence is collected. The choice belongs to the service's capacity process; this article supplies the release observation and the conditions needed to reproduce it. Keep the comparison result next to the build and profile identifiers so a later reader can tell whether a lower total came from the startup setting, a quieter page, a colder browser, or a different host.
The temporary startup mitigation
For the affected headless or automation workload, the temporary startup setting is:
--disable-features=WebUIOmniboxPopup,WebUIOmniboxAimPopup
Pass both feature names together. Disabling only one is not the same mitigation. This setting changes the browser's own address-bar interface. It does not alter page JavaScript, DOM, or CSS. In headless operation there is usually no visible user-facing effect, which is why it can be a practical short-term capacity measure for services that have validated the tradeoff.
The setting is not a permanent capacity guarantee and should not be presented as a BotBrowser-only correction. Chromium rollouts can change the underlying behavior, remove the setting, or ignore it. After starting a browser with the setting, observe actual memory on the target release rather than assuming the setting is still active. Keep the launch configuration versioned and attach its measurement to the release record.
There is a second setting worth distinguishing:
--disable-features=PreloadTopChromeWebUI
In the affected examples, this can lower the memory used by the additional process, but it does not remove that process. It is therefore a partial reduction, not a complete workaround. If the operating limit depends on removing the extra cost, use the two-name omnibox setting only after validating the resulting browser behavior and memory profile.
Treat startup settings as a release input. Compare no setting, the complete temporary setting, and the partial setting on the same host and workload. Record whether the extra process is present, the group total, the per-context slope, page behavior, and close behavior. Do not assume that a setting accepted by one build has the same effect in a later rollout.
The comparison should include a control group with no mitigation. Without that control, a lower total may be attributed to the setting when it actually came from a quieter page or a different warm-up state. Keep the order of the runs documented, allow the host to return to its normal idle range between groups, and repeat a run when a supervisor restart or unrelated service affects the result. These checks do not require page content to be retained. Resource totals, lifecycle times, release metadata, and workload class are enough to decide whether the setting changes capacity for the service.
Mitigation boundary
If memory pressure comes from page data, media, workers, downloads, or a lifecycle defect, a browser-UI setting is not evidence of the root cause. Use the linked operational guides for that diagnosis.
Per-context profiles remain useful for authorized storage and identity separation, but they do not make every resource shared or free.
The general rollout procedure belongs to the browser release validation routine; the Chromium 151 memory evidence and setting-specific decision are recorded here.
Record the exact build, host and workload conditions, observed process presence, comparable group totals, setting tested, and close behavior. This evidence supports a release-specific follow-up, not an operating runbook.
BotBrowser documents Per-Context Fingerprint (ENT Tier3), which can run many BrowserContexts in one browser instance, each with its own profile and per-context settings, while the browser, GPU, and network processes stay shared. That helps teams keep identity separation and validate the per-context memory slope on the exact release in a documented per-context workflow. BotBrowser cannot remove the Chromium 151 browser-UI renderer cost, guarantee a memory figure or operating limit, or size host headroom, and it does not replace measurement on the target release, host, and workload. Renderer processes still scale with page count.
The extra browser-UI renderer seen in some builds is a real cost while contexts remain live, and its release after context close is a useful observation. The linked capacity guide owns the operational response.
For readers comparing a release, these measurements provide a concrete checkpoint: preserve the inputs, compare like with like, and publish the limits of the observation beside the result. That makes the case useful without turning it into a promise.
Release conclusion
Re-measure the candidate build with and without the temporary setting before rollout. BotBrowser supplies per-context isolation; host policy remains an operator responsibility.
Evidence boundary and reproducible experiment
The version numbers, memory figures, renderer presence, and feature-flag effects reported here are author experiment observations, not Chromium commitments or BotBrowser guarantees. To reproduce the comparison, pin the two exact Chromium builds, use the same Linux x64 image, container limit, profile policy, extensions, graphics mode, and representative transaction, then run three groups: no flag, both omnibox names, and PreloadTopChromeWebUI. Record the browser group's RSS (for example with /proc/<pid>/status or an equivalent process monitor) before creation, at each live-context count, during warm activity, and after each close. Repeat each point until the slope is stable, report the host and workload boundaries, and treat the result as invalid after a release, host, profile, extension, graphics, or workload change. The flags have no public stability guarantee; validate their effect on every target build.
The Chromium multi-process architecture, Chrome DevTools Protocol browser-context methods, and Linux /proc process status reference explain the public process, context, and measurement surfaces. They do not substantiate the example MB values or flag behavior.
For a useful comparison record, keep the two exact build identifiers beside every memory sample. Note whether the browser group was newly started or warm, whether contexts were idle or actively navigating, and whether the host returned to its normal idle range between flag groups. Capture process presence as an observation rather than inferring it from the total RSS. A repeat run should use the same context creation order and the same close wait. These details make the release difference auditable and repeatable without implying that the experiment covers other hosts, page classes, graphics modes, or future maintenance builds.
Release decision
Treat the observed increase as a reason to remeasure the target maintenance build and validate any temporary setting before rollout. Do not derive a universal concurrency limit from these figures. The capacity planning guide owns host headroom and admission policy.
Sources
This article is part of the guide: Browser Deployment and Release: Operations Map
Related Articles
BrowserContext Capacity Planning for Memory and Long-Running Sessions
DeploymentScaling Browser Contexts with Per-Context Profiles
DeploymentStandard or Trimmed Build on Linux x64
DeploymentBrowser Automation Performance: Optimizing for Scale
DeploymentBrowser Deployment and Release: Operations Map
DeploymentBrowser Container Resource Limits: A Practical Planning Method
Run the same check in BotBrowser
Load a profile, keep the signals you just read about consistent inside the browser, and confirm the result on your own machine before a rollout.