Reading Browser Market Share Data Without Overclaiming
Learn how collection methods, sampling, device splits, and denominators limit what browser usage reports can show.
BotBrowser Team
Want the structured docs for Documentation?
This article lives in the editorial library. For step-by-step setup, reference material, and ongoing updates, jump into the docs section.
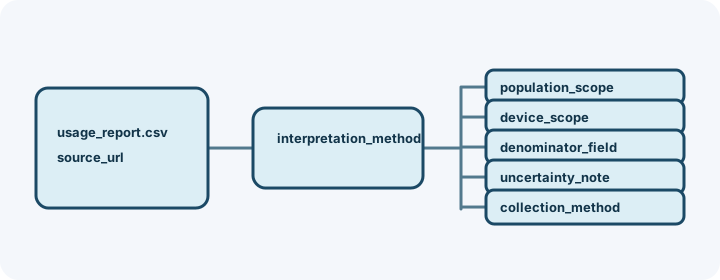
Browser usage reports are useful summaries, but they are not a scoreboard for product quality. A percentage depends on who was observed, how events were collected, which devices were included, and what denominator was chosen. BotBrowser Team can repeat an authorized declared browser journey beside that public evidence; it cannot validate a third-party dataset or turn an aggregate into evidence about an individual.
TL;DR
- Read the collection method, population, device scope, and denominator before comparing percentages.
- Treat an aggregate as context for choosing a compatibility question, not proof of quality, causation, or identity.
- Keep public usage data separate from the result of a controlled browser journey.
Contents
- Start with the measurement source
- Check population and sampling
- Separate desktop and mobile
- Respect the privacy boundary
- BotBrowser capability and limitation
- Use a cautious decision record
- Practical conclusion
Start with the measurement source
Read the methodology before reading the percentage. The StatCounter FAQ explains that its statistics are based on page views and describes how reports should be interpreted. A page-view dataset answers a different question from installed-browser telemetry, survey responses, or a controlled compatibility matrix. Do not combine them as if they were interchangeable.
Record the collection method, reporting window, geography, included properties, and whether the value counts page views, sessions, users, or devices. A report without these fields is a lead for further research, not a precise claim. The browser market-share analysis applies the same rule to aggregates: preserve unit, filter and observation window instead of comparing a percentage and a single captured ordinal.
Check population and sampling
An aggregate describes the observed population. It may overrepresent sites, regions, connection types, or devices that are measured more often. A change can reflect a change in traffic mix, instrumentation, or reporting coverage rather than a browser release or user preference.
| Question | Record | Avoid concluding |
|---|---|---|
| Who was observed? | geography, properties, date window | every browser user behaves the same way |
| What was counted? | views, sessions, users, or devices | a percentage is an individual probability |
| How was it grouped? | browser family, version, platform | a family label proves engine or feature quality |
| What changed? | source and denominator across periods | correlation proves a release caused the change |
Keep the original source and revision date. If two reports disagree, compare definitions first. A difference may be expected when their populations or counting units differ.
Build a comparable baseline by choosing one source and keeping its definitions stable for the question at hand. Write down the exact report URL, query filters, date range, region, device category, browser grouping, and denominator. Save a copy of the methodology that was available when the observation was made. Public dashboards can revise historical values, rename categories, or change default filters; a later reader should be able to tell whether a number changed because the world changed or because the report changed.
Do not silently blend a page-view series with a user series. A page view is an event, not a person, and repeated views can come from the same device or session. A user estimate can use a different deduplication rule. A device estimate can include shared computers, embedded browsers, and automated traffic. These are not interchangeable units even when their labels look similar.
Explain changes without inventing causes. When a share rises, list plausible explanations before selecting one: a change in measured sites, a campaign, a platform migration, a browser release, or a reporting-method change. Check which explanations are supported by the source and which require separate evidence. A usage report can show that the observed mix changed; it normally cannot show why. Keep causal language out of the headline unless an independent study supports it.
For a product decision, translate the aggregate into a bounded follow-up question. Instead of asking whether a browser is “winning,” ask whether a named journey works on a named platform, whether a release needs a compatibility test, or whether a responsive layout needs another viewport. The aggregate helps prioritize the question; a controlled, authorized journey answers only its own assertion.
Separate desktop and mobile
Desktop and mobile traffic have different hardware, operating systems, embedded browsers, and usage patterns. A combined figure can hide a meaningful split. Report the split when the decision concerns responsive layout, touch input, WebView behavior, or a mobile-only release. Do not use a global aggregate to answer a platform-specific compatibility question.
When comparing periods, hold the device categories and denominator definition steady. If the categories changed, mark the result as non-comparable instead of smoothing the difference into a trend.
Respect the privacy boundary
The W3C Privacy Principles provide vocabulary for actors, purposes, necessity, and proportionality. An aggregate can reduce detail, but aggregation alone does not establish that collection was necessary, that a person is anonymous, or that no other signal exists. Never turn a market-share percentage into a fingerprint, identity, or user-level prediction. For checking privacy statements against public sources, see how to evaluate browser privacy claims with public evidence.
BotBrowser capability and limitation
BotBrowser supports controlled contexts that can repeat an authorized, declared browser journey with fixed inputs and record visible workflow outcomes. BotBrowser cannot validate a third-party dataset, determine its population, or turn an aggregate into evidence about an individual. This is useful when a usage report suggests a compatibility question: define a narrow fixture, document the browser and device assumptions, and compare the observed result with the public aggregate without treating either as universal. See the browser comparison methodology and feature quality guide for adjacent evidence boundaries.
BotBrowser does not collect or validate StatCounter data, determine the source population, infer users from aggregate reports, or prove that a market trend caused an application outcome. Its repeatable journey evidence is a separate operational layer, not a replacement for the dataset's methodology.
Use a cautious decision record
Use the following review worksheet when a stakeholder sends a chart: preserve the chart, identify the publisher and countingUnit, copy reportFilters, compare definitions across periods, write the smallest decision supported by the data, and list the missing evidence. This prevents treating a population statistic as a runtimeAssertion. A market report can prioritize validation; it cannot replace a test that names an origin, permissionState, input, browserVersion, or visible result. Conversely, a controlled test cannot estimate a market.
Use a separate method for each follow-up: browser comparison methodology defines controlled product journeys; feature quality guidance separates API support from outcomes; responsive viewport properties covers layout conditions; privacy-claim review limits privacy conclusions; browser test evidence structures runtime records; open research reproducibility preserves methods; context capacity planning estimates workload; and release validation handles version changes. These references answer different questions and do not validate a market-share dataset.
Use the following sequence when a stakeholder sends a chart and asks for a decision. First, preserve the chart and identify the publisher, collection method, dateWindow, geography, properties, and unit. Second, copy the exact filters and note whether the chart combines desktop, mobile, tablet, or embedded traffic under one deviceCategory. Third, compare the current browserGrouping definition with the previous period before describing an increase or decrease. Fourth, write the smallest decision the data can support, such as prioritizing a test on one platform. Fifth, list the evidence that is still missing, including a controlled journey, a release note, or a separate accessibility check.
Keep the two evidence layers adjacent, with their different scopes visible: the report supplies observedShare for a named population, while the controlled fixture supplies an expected visible result. A report does not become a runtime assertion, and one fixture does not become a market estimate.
Suppose a report shows that a browser family accounts for more page views in a particular region during one month. A defensible conclusion is that the observed observedShare for that source and period should influence the next compatibility test. An indefensible conclusion is that the family is technically superior, that its users prefer a feature, or that a site can identify those users from the percentage.
The same discipline applies to privacy language. “The report aggregates page views” describes a measurement choice and a declared privacyPurpose. “The report makes people anonymous” is a privacy guarantee that the report cannot establish. Use the W3C vocabulary to identify actors and purposes, then ask what additional evidence would be needed. If the answer requires private telemetry or a named site's server logs, mark that boundary instead of filling it with speculation.
For example, a product manager may see a mobile browser family rising in a regional chart and ask whether a desktop layout can be retired. The chart can justify a responsive-layout review, but it cannot show the same input model, viewportWidth, accessibility support, or payment flow. Define those assertions separately, then test each with an owned journey and stated result. The chart remains context, not a substitute.
An engineer may see a short-lived drop after a browser release and ask whether a feature was removed. The report alone cannot answer that. Check category definitions, the release timeline, and represented sites; then run a small featureName support and visible-result fixture. Record API availability, permission usability, and journey completion. The report can prioritize the work but cannot identify the cause.
An analyst may ask whether two vendors can be compared by their percentages. Compare them only when collection method, population, period, device scope, and denominator align. Otherwise state that sources are not comparable. A table with unlike denominators creates false precision, even when every cell is real.
Keep the record reviewable: include sourceUrl, retrievedAt, visible filters, denominator text, device categories, allowed export, uncertainty note, follow-up owner, and revisionDate. Link a controlled fixture separately and state that it answers a different question. When the source revises its methodology, open a new record instead of silently editing the old conclusion.
A reviewable record lets another engineer reproduce the interpretation without private user data. Retain the minimum aggregate needed, avoid raw identifiers, and do not join a public percentage with account or fingerprint data. Ask whether a narrower platform test or public source can answer a follow-up without increasing collection.
State who owns the follow-up in followUpOwner and what would change the decision. A compatibility owner might rerun the fixture after a release; a privacy owner might review whether the collection purpose changed. This keeps an aggregate from becoming permanent after its methodology changes.
Use confidence language that matches the evidence. “Observed in this report” is stronger than “the market uses,” while “requires a controlled test” is more useful than “unknown.” Name the missing denominator, device class, or causal evidence in uncertaintyNote; never invent a confidence interval.
Finally, separate public facts from priorities. A team may test a browser because observed traffic matters to it, not because the report proves superior technology or a universal trend. Keep the source claim, controlled result, and product decision as linked but distinct records under decisionRecord.
The same worksheet helps when a report is used in a privacy review. Identify whether the source describes a browser family, a version, a platform, or a site population. These labels are descriptive categories, not personal identifiers. Ask what parties created the data, what purpose the collection served, how long the records were retained under retentionPeriod, and whether the published result is sufficiently aggregated for the decision. If those questions cannot be answered from the public method, write that uncertainty down rather than assuming the most favorable interpretation.
It also helps during a release review. A rise in one browser category may justify adding a release to a test matrix, but the matrix should name the feature, origin, permissionState, viewport, input, and expectedResult. A passing support check is not proof of an end-to-end transaction, and a market percentage is not proof that a transaction will occur. Keep the release evidence and the usage context in separate fields so a later reader can see which statement came from which source. The article on browser test evidence and reporting quality covers how to write up such a matrix.
For accessibility work, avoid treating a device split as an accessibility proxy. A mobile or desktop label does not reveal assistive technology, zoom settings, input method, or user preference. Use the aggregate only to decide which environments deserve attention, then run an authorized journey with the relevant inputModality and record the visible outcome. Do not infer the presence or absence of a disability from a browser category.
For capacity planning, distinguish traffic share from work intensity. A small share can produce substantial requests if its journeys are long, media-heavy, or concentrated in a particular service. A large share can be inexpensive if its sessions are short. A page-view report cannot supply the workload shape by itself, so pair it with an authorized, minimized performance or request fixture and state exactly what was measured in requestCount. This prevents a percentage from becoming an unsupported infrastructure forecast.
Finally, set a reviewDate. Browser categories, reporting methods, device mixes, and privacy expectations change. A bounded conclusion should expire or be rechecked when the source changes its definitions, when the application changes its journey, or when a browser release changes the relevant feature. Keeping that lifecycle visible is more reliable than copying the same percentage into every planning document.
Add one more check before a chart enters a roadmap: ask whether the reported unit matches the decision's unit. A page-view share may help order browser fixtures, but it cannot estimate active accounts, checkout attempts, support requests, or revenue exposure. Those decisions need their own approved operational evidence. Also record whether the chart is a snapshot or a revised series in seriesVersion. A later revision should create a new interpretation record with the old observation retained, so reviewers can distinguish a changed measurement from a changed browser population. This small discipline keeps a familiar percentage from quietly acquiring a meaning that the source never claimed.
For readers choosing a test next week, the practical output is a short, reproducible brief: name the source, freeze the filters, state the device scope, and write one observable browser assertion in expectedResult. For example, a team can use a regional mobile split to prioritize a responsive checkout fixture, then record whether the declared journey renders, accepts input, and reaches its expected result. The brief should say that the chart selected the fixture, while the fixture supplied the runtime result. That wording preserves the value of public data without making it carry evidence that belongs to a controlled test.
Sources
Practical conclusion
Use an aggregate to prioritize one named follow-up, then state which evidence answers each question. Keep the source, population, filters, and denominator with the report; keep the controlled journey and its visible result in a separate record. Do not publish a quality, causal, privacy, or individual-level claim that those records do not support.
Related Articles
How to Evaluate Browser Privacy Claims with Public Evidence
Getting StartedBrowser Test Evidence and Reporting Quality
PlatformA Fair Browser Comparison Methodology for Product Teams
PlatformWeb Vitals: How to Read Field Data and Lab Data Together
ComparisonResponsible Browser Feature Testing on Owned Apps
ComparisonBrowser Privacy Policy Review Before a Product Release
Run the same check in BotBrowser
Load a profile, keep the signals you just read about consistent inside the browser, and confirm the result on your own machine before a rollout.